Physical Address
304 North Cardinal St.
Dorchester Center, MA 02124
Physical Address
304 North Cardinal St.
Dorchester Center, MA 02124

Mysteries of your genetic past unfold through DNA segments, revealing ancestry and connections. What stories do these segments tell about your heritage?
A DNA segment is a continuous stretch of genetic material on a chromosome, defined by specific start and end positions along the genome. Each segment contains sequences of nucleotides passed down through generations, carrying the genetic information that connects you to your ancestors. Understanding DNA segments is fundamental to genetic genealogy because shared segments between individuals indicate potential familial relationships and common ancestry.
DNA segments are measured in centimorgans (cM), a unit that represents the probability of recombination between two positions on a chromosome. When you take an autosomal DNA test, companies like AncestryDNA, 23andMe, and MyHeritage analyze hundreds of thousands of data points to identify segments you share with genetic matches. The length and number of these shared segments help determine how closely related you might be to another person.
In 2026, genetic genealogy has become increasingly sophisticated, with advanced tools helping researchers distinguish between meaningful inherited segments and random genetic similarities. This guide will explain what DNA segments are, how they are measured, the different types of shared segments, and how to interpret them for your family history research.
A DNA segment is a specific section of DNA located on a chromosome, bounded by defined start and end points within the genome. In humans, DNA is organized into 23 pairs of chromosomes, and the segments you inherit from your parents can vary significantly in both size and genetic composition. Each segment represents a portion of your genetic map that has been passed down through generations of ancestors.
At the molecular level, DNA segments are composed of base pairs arranged in specific sequences. These sequences contain genetic markers known as SNPs (Single Nucleotide Polymorphisms), which are locations where your DNA might differ from other individuals. DNA testing companies typically examine between 700,000 to 800,000 SNPs across your genome to identify matching segments with other testers.
Shared segments are identical pieces of DNA found between two or more individuals. These matching segments are crucial in genetic genealogy because they suggest inheritance from a common ancestor. When you and another person share a segment of sufficient length, it indicates that you both inherited that specific stretch of DNA from a shared ancestor somewhere in your family trees.
The length of shared segments is measured in centimorgans, abbreviated as cM. A centimorgan is not a physical distance but a genetic distance that measures the probability of recombination occurring between two points on a chromosome. Generally, genetic genealogists consider segments of at least 7 centimorgans to be significant for ancestry research, though some researchers use even higher thresholds to reduce false positives.
Your autosomal DNA contains approximately 7,400 centimorgans total. You inherit roughly half from each parent, meaning you share about 3,700 centimorgans with either your mother or father. These shared centimorgans are distributed across 22 autosomal chromosome pairs, with the 23rd pair being the sex chromosomes that determine biological sex.
Also Read: What Is AncestryDNA Triangulation? – Family History Guide
Understanding the different types of shared DNA segments is essential for accurate genealogical interpretation. When two individuals show matching DNA segments, those segments fall into distinct categories that have very different implications for family history research. Learning to distinguish between these types will help you avoid false conclusions and focus on genuine ancestral connections.
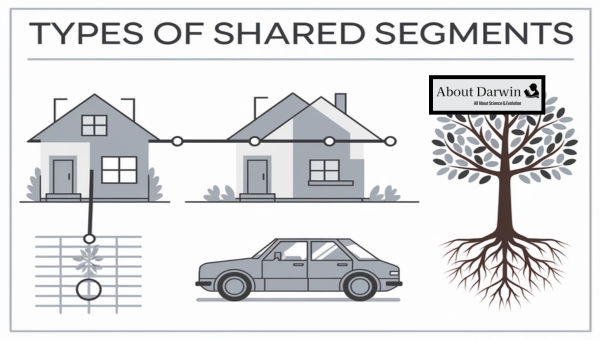
Identical By Descent (IBD) segments are stretches of DNA that two individuals share because they inherited them from a common ancestor. These segments have been passed down through the generations from a shared forebear, making them the most meaningful type of matching DNA for genealogical research. IBD segments are the foundation of genetic genealogy and the primary reason DNA testing can help you discover relatives and build your family tree.
When you identify an IBD segment with a genetic match, you can trace that shared DNA back through both of your family trees to find where they intersect. The length of an IBD segment often correlates with how recently you share a common ancestor. Longer segments typically indicate closer relationships, while shorter segments may suggest more distant connections several generations back.
Segments longer than 15 centimorgans are almost always IBD and indicate a relatively recent common ancestor, typically within the past 5-7 generations. Segments between 7 and 15 centimorgans are also likely to be IBD, though the common ancestor may be further back in time. These segments are the most reliable indicators of genuine genealogical relationships.
Identical By Chance (IBC) segments, also sometimes called Identical By State (IBS), are matching DNA segments that appear similar but were not inherited from a common ancestor. Instead, these similarities occur randomly because of how DNA recombination and inheritance work. Small segments, particularly those under 7 centimorgans, have a significant chance of being IBC rather than truly inherited from a shared forebear.
IBC segments occur because you have two copies of each autosomal chromosome, one from your mother and one from your father. When comparing your DNA to another person, a small segment might appear to match by alternating between your maternal and paternal copies in a way that creates a false positive. This phenomenon becomes more common with smaller segments and more distant comparisons.
Understanding IBC is crucial because chasing these false matches can waste valuable research time. This is why experienced genetic genealogists often filter out segments below 7 centimorgans and focus on larger, more reliable IBD segments. Some researchers prefer an even more conservative threshold of 10 or 15 centimorgans to maximize confidence in their matches.
Half-Identical Regions, commonly abbreviated as HIR, are segments where two individuals share one identical copy of a chromosome stretch. Because humans have two copies of each autosome, you can share DNA with another person on just one of those copies. This is the standard way most DNA testing companies report matches, which is why you typically see your total shared DNA measured in a way that accounts for these half-identical matches.
When you examine a chromosome browser showing your matches, the colored bars typically represent these half-identical regions. Full siblings are an exception to this pattern, as they can share both copies of a chromosome segment in what is called a Fully Identical Region (FIR). This distinction between half-identical and fully-identical sharing helps explain why sibling matches show different patterns than matches with more distant relatives.
Distinguishing between Identical By Descent (IBD) and Identical By Chance (IBC) segments is perhaps the most critical skill in genetic genealogy. The difference determines whether a DNA match represents a genuine genealogical connection worth investigating or a statistical artifact that will lead you down false research paths. Understanding these concepts separates successful genetic genealogists from those who struggle with DNA testing results.
IBD segments serve as verifiable links to your ancestral past. Each IBD segment you share with a match represents a specific piece of DNA that descended from a common ancestor to both of you. By comparing family trees and identifying where they intersect, you can confirm these connections and potentially extend your pedigree further back in time. IBD segments over 15 centimorgans are especially valuable because they almost certainly indicate a traceable common ancestor within a reasonable number of generations.
In contrast, IBC segments can mislead researchers into pursuing connections that do not exist. Small segments below 7 centimorgans have a substantial probability of being IBC, particularly in populations with high degrees of shared ancestry. Focusing on these small segments without additional evidence can result in incorrect tree attachments and wasted research effort. This is why reputable genetic genealogy resources consistently recommend establishing minimum segment thresholds for serious analysis.
The practical application of this knowledge involves setting appropriate filters when analyzing your DNA results. Most chromosome browsers and third-party tools allow you to specify minimum segment sizes. Setting this threshold to 7 centimorgans eliminates many IBC false positives while preserving genuine IBD matches. For endogamous populations, where many people share common ancestors, even higher thresholds of 10 or 15 centimorgans may be necessary to obtain reliable results.
Another important consideration is that IBD segments become smaller with each passing generation due to recombination. As DNA passes from parent to child, chromosomes exchange segments in a process called crossover. Over multiple generations, this fragmentation means that distant cousins will share smaller IBD segments than close relatives. Understanding this natural decay helps set realistic expectations for what you can discover with DNA testing.
One of the most confusing aspects of genetic genealogy is that different DNA testing companies report different numbers of segments for the same match. If you upload your raw DNA data to multiple platforms, you may notice that AncestryDNA, 23andMe, and MyHeritage each show a different segment count for what appears to be the same relative. Understanding why these differences exist will help you interpret your results more accurately.
AncestryDNA uses proprietary algorithms that apply a process called Timber to filter out segments they believe are more likely to represent population-level shared DNA rather than recent genealogical connections. This filtering can reduce the number of reported segments compared to other companies. While this approach aims to reduce false matches, it may also eliminate some genuine smaller segments that other platforms would display.
Additionally, AncestryDNA does not provide a chromosome browser, which means you cannot see exactly where on each chromosome your shared segments are located. You only receive the total shared centimorgans and the number of segments. This limitation requires users who want detailed segment analysis to download their raw DNA data and upload it to third-party tools like GEDmatch or MyHeritage.
23andMe typically reports more segments than AncestryDNA for the same relationship because they use different matching algorithms and thresholds. Their chromosome browser is one of the most user-friendly interfaces available, allowing you to visualize exactly which chromosome segments you share with each match. 23andMe also distinguishes between half-identical and fully-identical regions, which is particularly useful when analyzing sibling matches.
One unique aspect of 23andMe is that they show you the longest segment shared with each match in addition to the total shared centimorgans. The longest segment is often more informative for relationship prediction than the total shared DNA, especially for more distant relationships where the total may be inflated by many small segments of questionable genealogical significance.
MyHeritage DNA generally reports the highest number of segments among the major testing companies because they use less aggressive filtering in their matching algorithms. Their chromosome browser is robust and includes a triangulation feature that helps identify segments shared by three or more people, which is extremely valuable for confirming common ancestors.
GEDmatch, a third-party analysis platform, allows users to customize their matching thresholds extensively. You can adjust the minimum centimorgan threshold and the minimum number of SNPs required for a match. This flexibility lets advanced users explore segments that commercial companies might filter out, though it also increases the risk of encountering IBC false matches.
The variation in segment counts between companies stems from several technical factors. Each company uses different thresholds for the minimum number of matching SNPs required to declare a segment. They also apply different algorithms for handling gaps or mismatches within segments, and they have varying approaches to handling areas of the genome known to have high levels of shared DNA across populations.
These differences do not mean one company is right and others are wrong. Rather, they reflect different philosophies about balancing sensitivity against specificity in DNA matching. The key takeaway is to use the total shared centimorgans as your primary guide for estimating relationships, while understanding that the number of segments alone is less meaningful due to these company-specific variations.
Genetic genealogy transforms abstract DNA data into meaningful family connections through careful analysis of shared segments. When you examine your DNA matches, you are looking at specific pieces of genetic evidence that can confirm documented relationships, break through brick walls in your research, and sometimes reveal unexpected branches of your family tree. The key to success lies in understanding how segment patterns correlate with different types of relationships.
A parent and child share exactly 23 segments of DNA, one on each chromosome pair. These segments cover approximately 3,475 to 3,700 centimorgans, representing the half of the child’s DNA inherited from that parent. Unlike other relationships, parent-child matches include the entire length of each chromosome, making them the easiest relationships to identify and verify.
When you view a parent-child comparison in a chromosome browser, you see solid blocks of shared DNA across all 22 autosomal chromosomes plus the X chromosome for mother-daughter and mother-son relationships. The pattern is unmistakable because there are no gaps where DNA was not inherited. This complete inheritance pattern provides a baseline for understanding how more distant relationships fragment that original parental DNA through recombination.
Grandparents and grandchildren typically share between 1,300 and 2,300 centimorgans across approximately 16 to 32 segments. The wide range reflects the randomness of recombination that occurs when DNA passes from parent to child. A grandchild does not inherit exactly 25 percent from each grandparent because the crossover points during recombination vary each generation.
When examining grandparent-grandchild matches in a chromosome browser, you notice gaps where segments were not inherited. These gaps represent chromosome sections where the child inherited DNA from their other parent, breaking the continuous chain from grandparent to grandchild. The pattern of shared and unshared regions creates a visual map of inheritance that genetic genealogists can analyze to understand which grandparent contributed specific DNA segments.
First cousins, who share a set of grandparents, typically match on 4 to 8 segments totaling between 400 and 1,300 centimorgans. The average first cousin match shares approximately 850 centimorgans, though the range can vary considerably due to the randomness of DNA inheritance. Some first cousins may share significantly more or less than this average, which is why genetic genealogists use ranges rather than precise predictions.
When you examine first cousin matches, you may notice that the shared segments are distributed across many different chromosomes. Each segment represents a piece of DNA inherited from one of the shared grandparents. By comparing which segments each first cousin shares with other relatives, you can sometimes determine which grandparent contributed each segment, a technique known as chromosome mapping.
The Shared cM Project, maintained by genetic genealogist Blaine Bettinger, provides empirical data on how much DNA different relationships typically share. This crowd-sourced database collects actual test results from genealogists who have verified their relationships through documentation. Using this resource, you can compare your match’s shared centimorgans against documented ranges to narrow down possible relationships.
For example, if you share 1,800 centimorgans with a match, the Shared cM Project data would indicate that person is likely a half-sibling, aunt, uncle, niece, nephew, or grandparent. You can then use additional clues like age, geography, and the number of shared segments to further refine the possibilities. This data-driven approach transforms DNA testing from guesswork into a systematic investigation.
Also Read: Princess Diana’s Family – A Royal Family Tree
Endogamy, the practice of marrying within a specific group or community, creates special challenges for segment analysis. Individuals from endogamous populations, such as Ashkenazi Jews, Acadians, or certain isolated geographic communities, may share multiple ancestors through different paths. This results in inflated shared DNA totals that can suggest closer relationships than actually exist.
When analyzing segments for people from endogamous backgrounds, genetic genealogists often focus on the longest segment rather than the total shared centimorgans. A single long segment over 30 centimorgans is more reliable evidence of a recent common ancestor than many small segments totaling a higher amount. Some researchers also use higher minimum thresholds of 15 or 20 centimorgans when working with endogamous populations to filter out the background noise of distant shared ancestry.
The field of genetic genealogy offers a rich ecosystem of tools that help you visualize, analyze, and interpret your DNA segments. From basic chromosome browsers provided by testing companies to sophisticated third-party utilities, these resources transform raw genetic data into actionable family history insights. Learning to use these tools effectively will dramatically improve your ability to work with DNA matches.
A chromosome browser is the most essential visualization tool for segment analysis. This interface displays your chromosomes as horizontal bars, with colored segments indicating where you share DNA with specific matches. By overlaying multiple matches on the same chromosome view, you can identify triangulated segments that three or more people share, strongly suggesting descent from a common ancestor.
23andMe, MyHeritage, and FamilyTreeDNA all provide built-in chromosome browsers for their customers. Each browser has unique features, but all allow you to select matches and view their shared segments across your genome. The ability to compare multiple matches simultaneously is crucial for identifying which relatives belong to the same ancestral line.
GEDmatch is a free third-party platform where users can upload raw DNA data from any testing company and compare it with testers from other services. The platform offers a suite of analysis tools including a chromosome browser, one-to-one comparison utilities, and matching segment reports. GEDmatch allows you to adjust matching parameters manually, which is valuable for advanced users who want to explore segments below standard company thresholds.
The One-to-One comparison tool on GEDmatch is particularly useful for examining specific matches in detail. You can specify minimum segment thresholds, see exactly how many SNPs match within each segment, and visualize the shared DNA across all chromosomes. This granular control makes GEDmatch indispensable for serious segment analysis.
DNA Painter is a revolutionary tool that allows you to paint your chromosomes with known ancestral information. As you identify which segments came from specific ancestors, you can color-code those segments on a virtual chromosome map. Over time, this creates a visual representation of your genetic ancestry that helps predict which ancestor unknown matches might share.
The Shared cM Tool on DNA Painter helps you determine possible relationships based on the amount of shared DNA. By entering the total centimorgans and number of segments, you receive a probability distribution of possible relationships based on real data from the Shared cM Project. This tool is invaluable when trying to figure out how a new DNA match fits into your family tree.
DNA triangulation occurs when three or more people share the same DNA segment in the same location on the same chromosome. When this happens, it strongly indicates that all three inherited that segment from a common ancestor. Triangulation is one of the most powerful techniques in genetic genealogy for confirming ancestral connections and mapping specific segments to particular family lines.
To perform triangulation, you need a chromosome browser that supports comparing multiple matches simultaneously. MyHeritage has a built-in triangulation feature, while GEDmatch and other tools allow you to accomplish the same result through manual comparison. Once you identify a triangulated segment, your goal is to find the common ancestor among the triangulated matches, which confirms the source of that DNA segment.
Pile-up regions are areas of the genome where many people share DNA segments, often due to ancient common ancestry rather than recent genealogical connections. These regions can create false positives in your match list, suggesting closer relationships than actually exist. Understanding pile-up regions helps you avoid misinterpreting these common segments as evidence of recent shared ancestry.
Most experienced genetic genealogists maintain a list of known pile-up regions to exclude from analysis. When you notice that many of your matches share a specific segment in the same location, particularly a smaller segment, it may indicate a pile-up region rather than a useful genealogical signal. Recognizing these patterns comes with experience and is an important skill for accurate segment interpretation.
A DNA segment is a continuous stretch of genetic material located on a chromosome, defined by specific start and end positions. Segments are measured in centimorgans (cM) and represent inherited pieces of DNA that can indicate familial relationships when shared between individuals.
On 23andMe, DNA segments represent matching stretches of DNA between you and a genetic relative. The platform displays the number of shared segments, total shared centimorgans, and the longest segment. The chromosome browser shows exactly where these segments appear on each chromosome, helping you visualize your genetic connections.
AncestryDNA reports the number of shared segments and total shared centimorgans for each match. However, unlike some competitors, AncestryDNA does not provide a chromosome browser to view where segments are located. They also apply proprietary filtering that may reduce the number of reported segments compared to other platforms.
First cousins typically share between 4 and 8 DNA segments totaling approximately 400 to 1,300 centimorgans, with an average of about 850 centimorgans. The exact number varies due to the randomness of DNA recombination and inheritance patterns.
A high cM DNA match typically refers to someone sharing over 1,000 centimorgans. Matches sharing 1,300 to 2,300 cM are likely grandparents, grandchildren, aunts, uncles, nieces, nephews, or half-siblings. Matches above 2,600 cM are usually immediate family members such as parents, children, or full siblings.
Approximately 2% DNA ethnicity typically traces back to a great-great-great-grandparent, representing about 5 to 6 generations. This roughly corresponds to a 4th great-grandparent who lived approximately 150 to 200 years ago, though the exact timeline varies based on generational spacing in your family.
The 7 centimorgan threshold is the minimum segment size that genetic genealogists typically consider significant for relationship analysis. Segments below 7 cM have a high probability of being Identical By Chance (IBC) rather than truly inherited from a common ancestor. Many researchers use even higher thresholds of 10 or 15 cM for more reliable results.
Identical By Descent (IBD) segments are DNA stretches inherited from a common ancestor and represent genuine genealogical connections. Identical By Chance (IBC) segments appear similar due to random genetic patterns but were not inherited from a shared forebear. IBD segments over 15 cM are highly reliable, while segments under 7 cM often require additional verification.
Also Read: Royal Family Tree – Tracing the Lineage
Understanding DNA segments opens a powerful window into your genetic ancestry and familial connections. These stretches of inherited DNA, measured in centimorgans and shared with genetic matches, serve as biological evidence of your place in the human family tree. By distinguishing between Identical By Descent and Identical By Chance segments, setting appropriate thresholds for analysis, and leveraging the sophisticated tools available in 2026, you can transform raw DNA data into meaningful genealogical discoveries.
The knowledge you have gained about segment analysis, chromosome browsers, and relationship prediction provides a foundation for confident genetic genealogy research. Whether you are confirming documented relationships, breaking through brick walls, or exploring unknown branches of your family tree, DNA segments offer verifiable evidence that complements traditional genealogical records. As DNA testing technology continues to advance and new tools emerge, your understanding of these fundamental concepts will remain essential for successful family history exploration.